Rebuilding a Published Hypertension Markov Model — and Verifying It

A four-state cost-effectiveness model from the ACCOMPLISH trial, reconstructed in R and checked against TECH-VER

Author

Xiaoge Zhang, PhD

Published

August 27, 2026

WarningWhat this is

A replication and verification of a published model, not a new clinical finding. Nothing here is evidence about how these two antihypertensive regimens compare; everything here is evidence about how one published comparison behaves when it is rebuilt from the numbers the paper prints.

Feng A, Lin W, Li L, Zeng M, Lyu J. Pharmacoeconomic evaluation of stroke and myocardial infarction prevention in hypertensive patients: Markov model based on the ACCOMPLISH trial. Journal of International Medical Research. 2023;51(12):1–15. doi:10.1177/03000605231214921 — CC BY-NC.

The rebuild is an independent R implementation of the paper’s four-state annual Markov cohort. The verification follows the five-stage structure of TECH-VER (Büyükkaramikli et al., PharmacoEconomics 2019;37:1391–1408), with the closing questions posed in the language of AdViSHE (Vemer et al., PharmacoEconomics 2016;34:349–361).

This is a methodological appraisal of an academic model. It was supported by a Chinese provincial research laboratory grant, and its authors declare no conflict of interest — there is no commercial sponsor and no product position at stake here. Nothing below should be read as questioning anyone’s good faith.

What this replication found

1 · The published results reproduce. QALYs are exact at the precision printed. On cost, hydrochlorothiazide reconciles immediately; amlodipine only once the drug price is taken from the paper’s own Figure 4, which prints a value 35 CNY a year below the one its Table 2 gives. How it was established — an independent R rebuild; cycle-10 cohort occupancy matching the paper’s text in six of six cells; the ranges printed on Figure 4 back-solved to their base values.

2 · Much of the model cannot be checked from the paper at all. No analytic perspective, no base-case discount rate, no observation period for the rate conversion, no distribution parameters behind the probabilistic analysis, no account of what the event costs contain — and no validation of any kind reported. How it was established — a reporting audit against TECH-VER’s completeness tests, with each absence confirmed across the full text rather than inferred from a search.

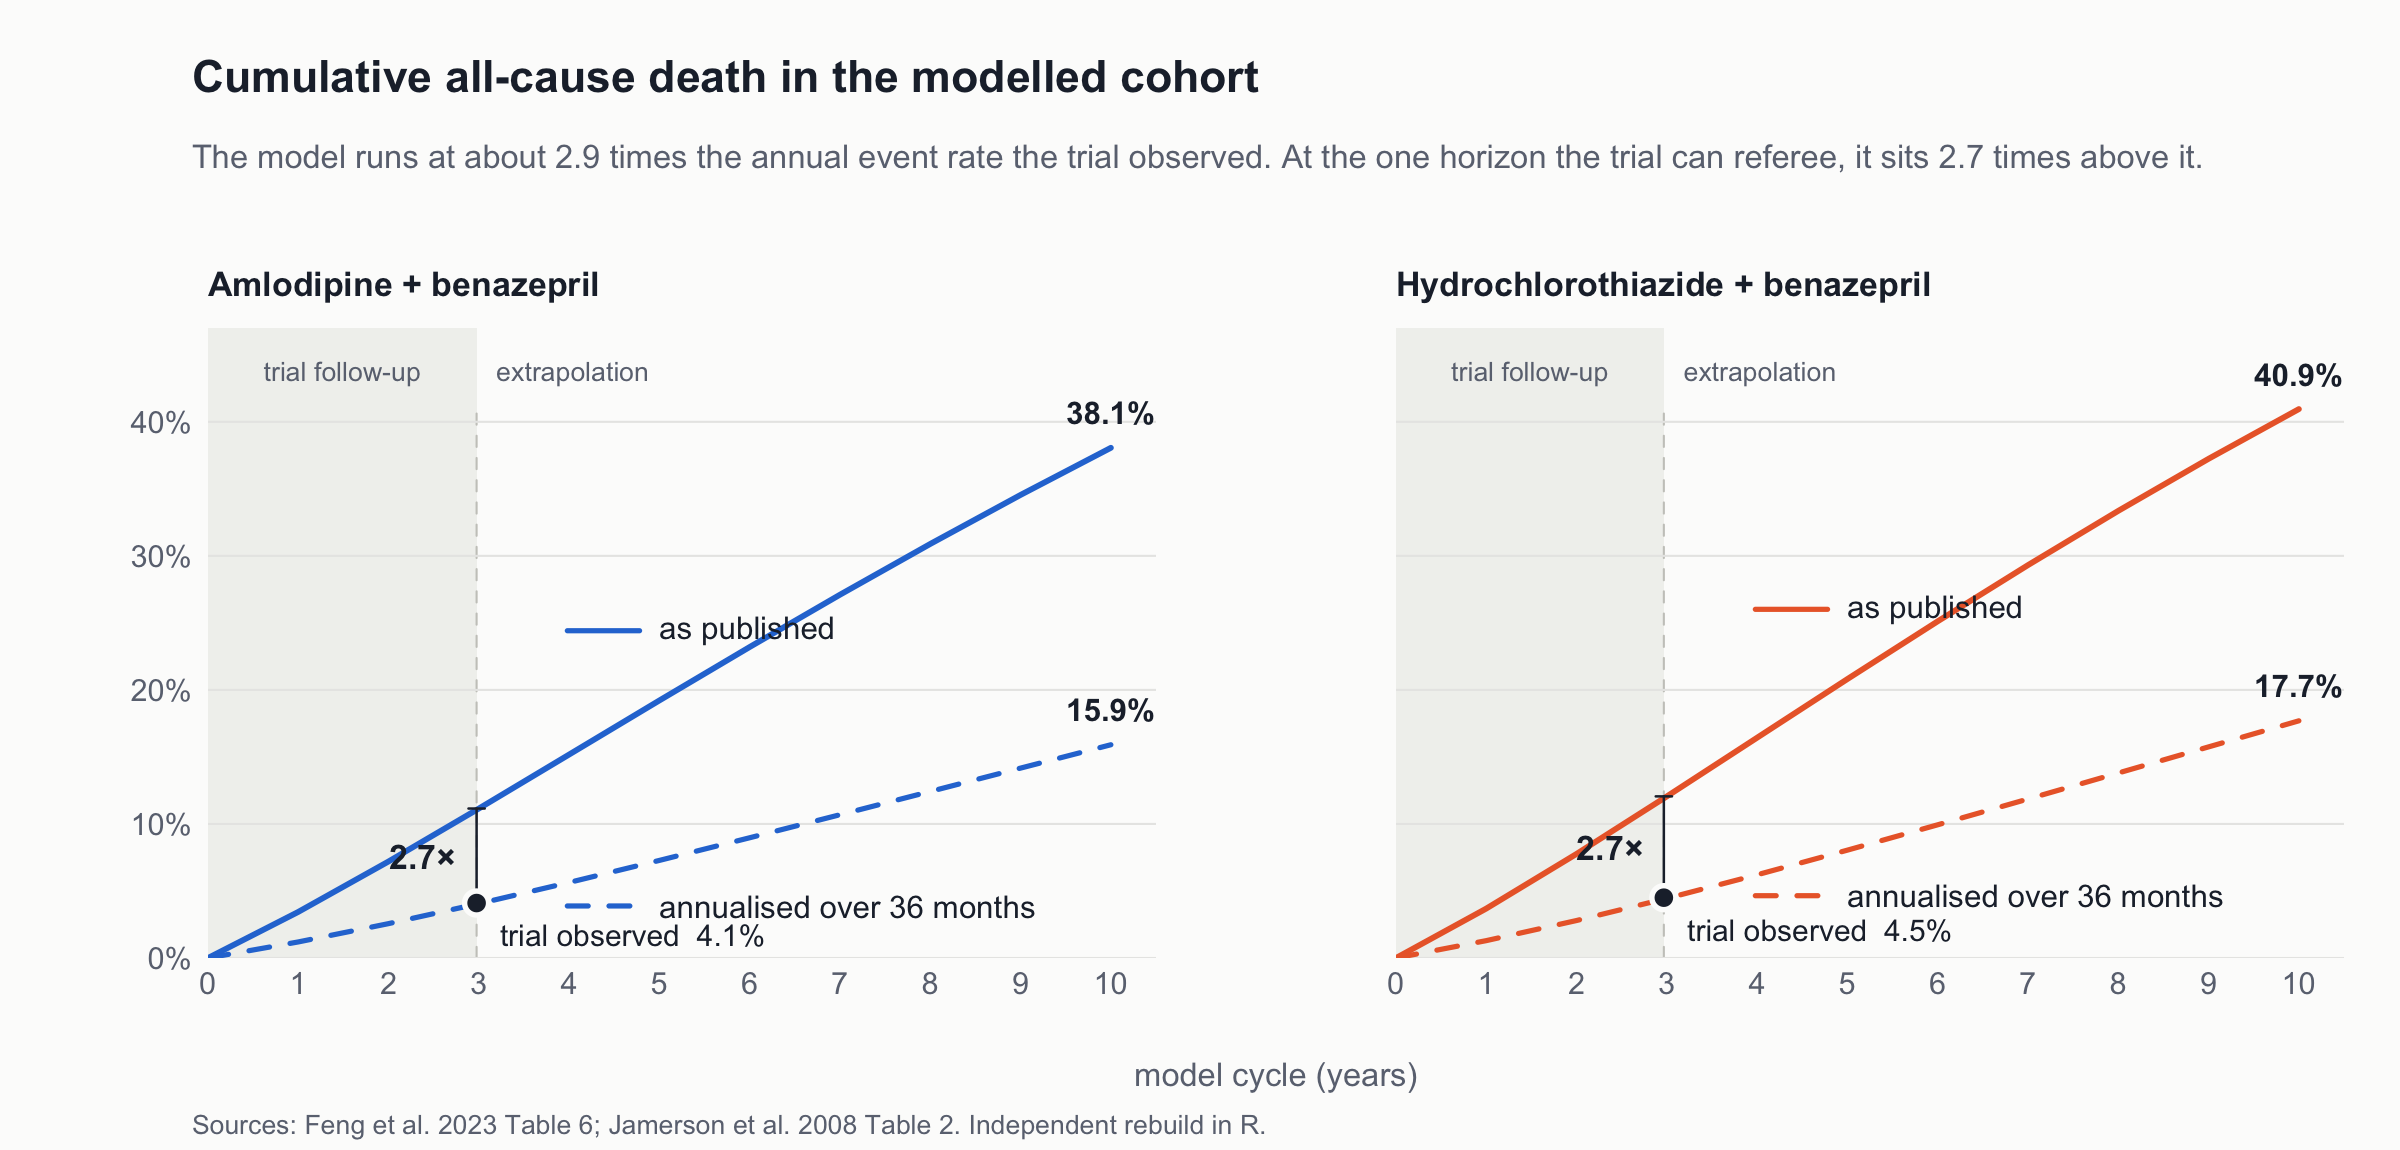
3 · The model runs at about three times the event rate its own trial observed. ACCOMPLISH’s percentages are cumulative over a mean 36-month follow-up and are used as one-year probabilities. The trial reports only cumulative proportions for the individual endpoints, but gives its primary composite as a rate per 1000 patient-years as well — the distinction is one it draws itself. Run the model over the trial’s own three years and it returns 11.2% cumulative death where 4.1% went in. How it was established — a round-trip test on the transition matrix, using no cost or utility value: the trial figure that went into the model does not come back out of it.

4 · The conclusion survives it. Correcting the conversion halves the health gain and narrows the cost gap by a third, and amlodipine still costs less and delivers more. Everything found here is about the size of the answer, not its sign. How it was established — the rebuild re-run on corrected transition probabilities, engine otherwise untouched.

5 · Half the modelled cost is an event charge levied every year, from a source that could not be obtained. The MI charge is applied on average 3.9 times per patient who has one; if it is a first-year cost, the cost gap falls to a third of the published one. How it was established — decomposing the rebuilt totals into drug and event-state components, then re-running with the event figures charged once.

6 · The paper’s own table and Methods disagree about where the utilities came from. Table 3 attributes two of them to ACCOMPLISH, which reports no utility outcome of any kind. The Methods name two economic evaluations instead; the two attributions overlap in only one reference, and the trial the table cites is absent from the Methods sentence entirely. How it was established — a full-text check of the trial, read against Table 3’s reference marks and the Methods sentence.

The bottom line. The analysis is competently built and it replicates. Its direction — that amlodipine plus benazepril is the more economical of the two regimens in China — survives every correction made here, including the largest. Its magnitudes do not, and much of the model cannot be checked from the paper at all. The conclusion is usable; the numbers should not be quoted.

1 · The model

A cohort of high-risk hypertensive patients — the ACCOMPLISH population, median age 68, 60% diabetic, 23% with prior myocardial infarction — moves through four health states in annual cycles for ten years. Two of those states are the events the treatments exist to prevent: myocardial infarction (MI, heart attack) and stroke.

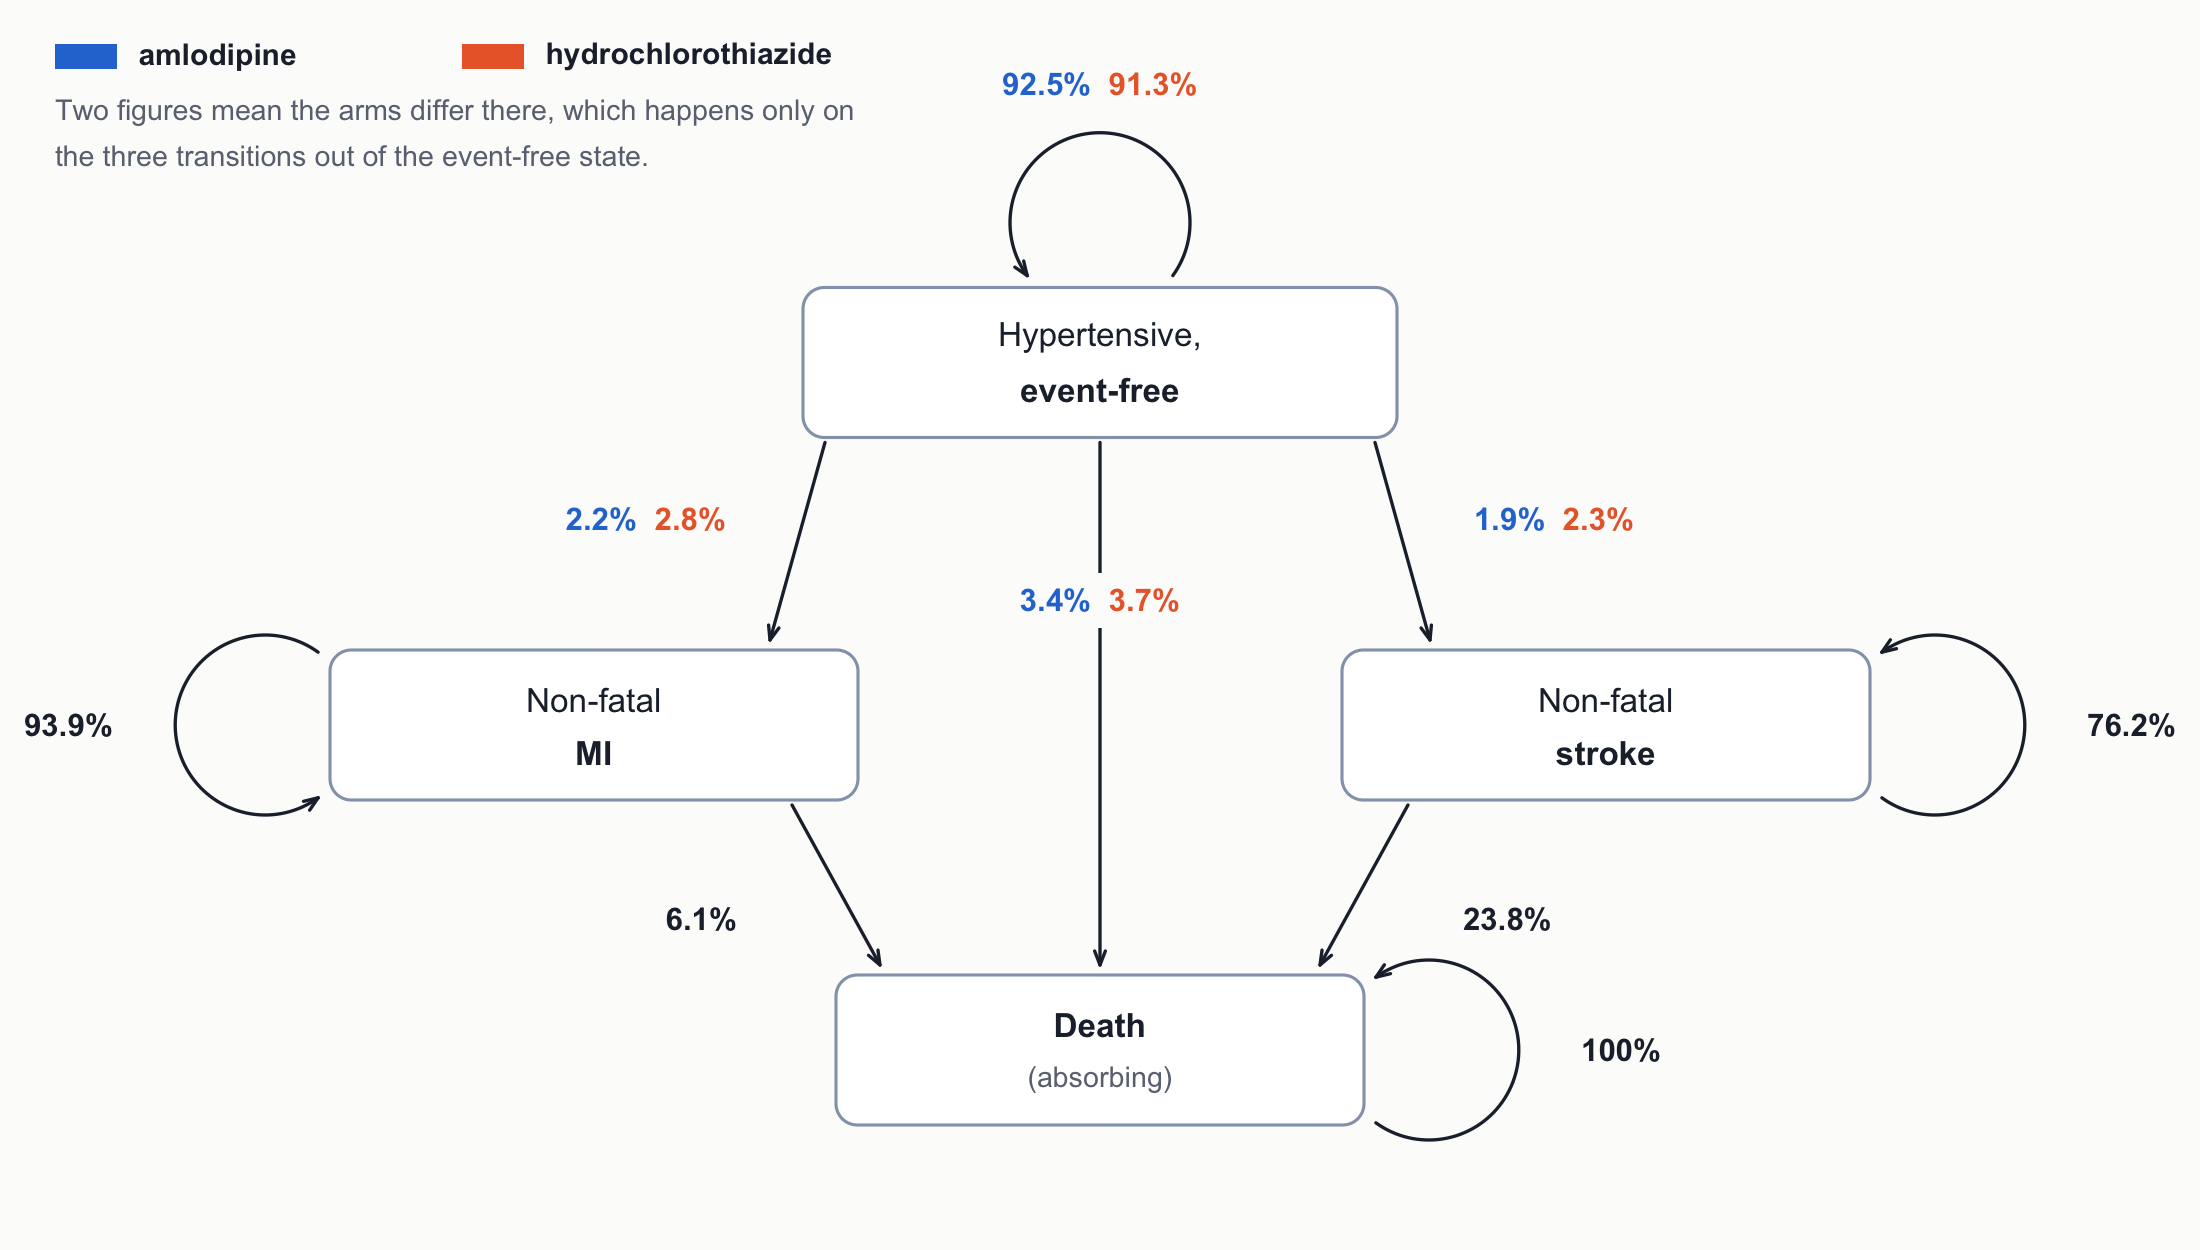
Figure 1: The four states and every transition the model allows, with the annual probabilities as published. Colour is the arm throughout this page — blue for amlodipine, orange for hydrochlorothiazide. Where a transition carries two figures the arms differ there, which happens only on the three edges leaving the event-free state; everywhere else the two arms are identical. The self-loops are where most of the cohort actually sits.

Three structural choices deserve naming, because each is a modelling decision rather than a piece of trial evidence.

  • No recurrent events, and no transition between MI and stroke. A patient who has an infarction can only stay in that state or die — never have a second infarction, and never go on to have a stroke.
  • Post-event mortality is identical in both arms (0.0611 from MI, 0.2381 from stroke). Treatment is modelled as acting only on whether an event happens, never on what happens afterwards.
  • The horizon is ten years, not lifetime. Whatever befalls the patients still alive at cycle 10 is outside the model.

All three are ordinary simplifications. Whether the paper declares them, and whether they hold up, is §3.

The transition matrices

Code
mat <- function(arm) {
  p <- TPM_PUBLISHED[[arm]]; d <- "&mdash;"
  f <- function(x) sprintf("%.4f", x)
  m <- data.frame(
    From = c("Event-free", "Non-fatal MI", "Non-fatal stroke", "Death"),
    `Event-free` = c(f(p[["EE"]]), d, d, d),
    `Non-fatal MI` = c(f(p[["EM"]]), f(p[["MM"]]), d, d),
    `Non-fatal stroke` = c(f(p[["ES"]]), d, f(p[["SS"]]), d),
    Death = c(f(p[["ED"]]), f(p[["MD"]]), f(p[["SD"]]), "1.0000"),
    check.names = FALSE)
  rs <- c(sum(p[c("EE", "EM", "ES", "ED")]), sum(p[c("MM", "MD")]),
          sum(p[c("SS", "SD")]), 1)
  m$`Row sum` <- ifelse(abs(rs - 1) < 1e-9, sprintf("%.4f", rs),
                        sprintf("**%.4f**", rs))
  m
}
nm <- c(amlodipine = "Amlodipine", hctz = "Hydrochlorothiazide")
for (a in c("amlodipine", "hctz")) {
  print(knitr::kable(mat(a), escape = FALSE, align = "lrrrrr",
    caption = sprintf("**%s + benazepril.** Columns are the state moved *to*; a dash is a transition the model does not allow.", nm[[a]])))
  cat("\n")
}
Amlodipine + benazepril. Columns are the state moved to; a dash is a transition the model does not allow.
From Event-free Non-fatal MI Non-fatal stroke Death Row sum
Event-free 0.9251 0.0218 0.0188 0.0344 1.0001
Non-fatal MI 0.9389 0.0611 1.0000
Non-fatal stroke 0.7619 0.2381 1.0000
Death 1.0000 1.0000
Hydrochlorothiazide + benazepril. Columns are the state moved to; a dash is a transition the model does not allow.
From Event-free Non-fatal MI Non-fatal stroke Death Row sum
Event-free 0.9127 0.0276 0.0227 0.0369 0.9999
Non-fatal MI 0.9389 0.0611 1.0000
Non-fatal stroke 0.7619 0.2381 1.0000
Death 1.0000 1.0000

Laid out as matrices, those structural choices are the dashes: the MI and stroke rows lead nowhere except back to themselves or on to death, and the death row leads only to itself. The event-free row sums to 1.0001 in the amlodipine arm and 0.9999 in the hydrochlorothiazide arm, so the printed matrix is not quite the matrix that was run.

Costs and utilities

Code
kb(data.frame(
  State = STATES,
  `Annual cost, amlodipine arm (CNY)` = c(COST_DRUG[["amlodipine"]],
    COST_EVENT[["MI"]], COST_EVENT[["Stroke"]], 0),
  `Annual cost, HCTZ arm (CNY)` = c(COST_DRUG[["hctz"]],
    COST_EVENT[["MI"]], COST_EVENT[["Stroke"]], 0),
  Utility = unname(UTIL[STATES]), check.names = FALSE),
  row.names = FALSE,
  caption = "Tables 2 and 3 of the paper. Every figure in Table 2 sits under the header Assignment/RMB/year.")
Tables 2 and 3 of the paper. Every figure in Table 2 sits under the header Assignment/RMB/year.
State Annual cost, amlodipine arm (CNY) Annual cost, HCTZ arm (CNY) Utility
EventFree 5494.53 5926.76 0.98
MI 48874.20 48874.20 0.87
Stroke 28023.80 28023.80 0.77
Dead 0.00 0.00 0.00

There is no micro-costing anywhere in this model. Cost enters as state occupancy × an annual state cost — four numbers for the whole analysis. The drug figures are a daily median tender price scaled to a year, with no dosing, adherence, monitoring or follow-up resource use behind them; the two event figures are taken whole from another study and adjusted to 2021 prices.

Time, discounting and software

Cycle 1 year
Horizon 10 cycles, not lifetime
Discount rate 5% — recovered rather than reported; see §3
Half-cycle correction not applied, and not mentioned in the paper
Software TreeAge Pro 2021

Every transition probability traces to one table in the ACCOMPLISH trial through a conversion the paper sets out in its Methods.

Code
kb(do.call(rbind, lapply(names(TRIAL), function(a) {
  t <- TRIAL[[a]]; p <- TPM_PUBLISHED[[a]]
  data.frame(Arm = a,
    `ACCOMPLISH MI` = sprintf("%.1f%%", 100 * t[["mi"]]),
    `1-exp(-p)` = sprintf("%.4f", 1 - exp(-t[["mi"]])),
    `Published PH-M` = sprintf("%.4f", p[["EM"]]),
    `ACCOMPLISH stroke` = sprintf("%.1f%%", 100 * t[["stroke"]]),
    `1-exp(-p) ` = sprintf("%.4f", 1 - exp(-t[["stroke"]])),
    `Published PH-S` = sprintf("%.4f", p[["ES"]]), check.names = FALSE) })),
  row.names = FALSE, caption = "The conversion, reproduced.")
The conversion, reproduced.
Arm ACCOMPLISH MI 1-exp(-p) Published PH-M ACCOMPLISH stroke 1-exp(-p) Published PH-S
amlodipine 2.2% 0.0218 0.0218 1.9% 0.0188 0.0188
hctz 2.8% 0.0276 0.0276 2.3% 0.0227 0.0227

The event-free death probability then follows by subtraction — all-cause annual death less the deaths already routed through the two event states — reproducing 0.0344 and 0.0369 to four decimals. The parameter chain is fully recovered. Whether the conversion itself is sound is a separate question, taken up in §3.

The utility rows need reading together. Table 3 marks the event-free and MI utilities to reference 13 — the ACCOMPLISH trial, which reports no utility, EQ-5D, SF-36 or quality-of-life outcome anywhere — and the stroke utility to reference 14. The paper’s Methods say something different: that the utilities “were derived from published studies of the same or similar populations”, citing references 14 and 19. Reference 13 does not appear in that sentence.

So the table and the text disagree, and the source the table names does not hold the values. Both papers those Methods point to are Chinese-language and were not obtainable here, which is exactly what a reviewer would need to settle it. Recorded as a citation-consistency problem, not a data-integrity one.

The table below is the data extraction document for this rebuild: one row per input, the source the paper cites for it, where that quantity actually sits in the cited work, any transformation applied, and whether the source could be located and checked. It is written for a reviewer who should not have to repeat the search to judge whether an input is appropriate.

Code
kb(read.csv("data/provenance.csv", check.names = FALSE))
Parameter Value Source as cited by the paper Where that quantity actually sits Transformation applied Verifiable
Event-free -> non-fatal MI, amlodipine 0.0218 Reference 13 (ACCOMPLISH) Jamerson 2008 Table 2, ‘Fatal and nonfatal myocardial infarction’, 125/5744 = 2.2% 1-exp(-0.022) Yes - source located; the 2.2% is cumulative over a mean 36-month follow-up, and includes fatal events
Event-free -> non-fatal MI, HCTZ 0.0276 Reference 13 (ACCOMPLISH) Jamerson 2008 Table 2, 159/5762 = 2.8% 1-exp(-0.028) Yes - same caveat
Event-free -> non-fatal stroke, amlodipine 0.0188 Reference 13 (ACCOMPLISH) Jamerson 2008 Table 2, ‘Fatal and nonfatal stroke’, 112/5744 = 1.9% 1-exp(-0.019) Yes - same caveat
Event-free -> non-fatal stroke, HCTZ 0.0227 Reference 13 (ACCOMPLISH) Jamerson 2008 Table 2, 133/5762 = 2.3% 1-exp(-0.023) Yes - same caveat
All-cause annual death (intermediate) 0.0402 / 0.0440 Reference 13 (ACCOMPLISH) Jamerson 2008 Table 2, ‘Death from any cause’, 4.1% / 4.5% 1-exp(-p) Yes - same caveat
Event-free -> death (PH-D) 0.0344 / 0.0369 Not separately sourced Derived inside the paper All-cause annual death minus MI incidence x PM-D minus stroke incidence x PS-D; reproduces to four decimals Yes - derivation recovered and reproduced
MI -> death (PM-D) 0.0611 Reference 13, via Table 4 ‘Myocardial infarction-related death 6.3%’ 6.3% occurs once in ACCOMPLISH: the HCTZ arm’s secondary composite endpoint, 364/5762 - not post-MI mortality 1-exp(-0.063) No - the quantity used is not locatable in the cited source
Stroke -> death (PS-D) 0.2381 Reference 13, via Table 4 ‘Stroke-related death 27.2%’ 27.2% does not appear anywhere in ACCOMPLISH 1-exp(-0.272) No - value absent from the cited source
Annual cost, event-free state, amlodipine 5494.53 CNY china-yao.com Provincial drug tender website; no version, date or accession given Daily median price scaled to a year No - source not retrievable as cited
Annual cost, event-free state, HCTZ 5926.76 CNY china-yao.com As above As above No - source not retrievable as cited
Annual cost, non-fatal MI state 48874.2 CNY Reference 14 (Zhu Y et al., Chin J Health Econ 2019;36:50-53) Chinese-language journal; original not obtained Adjusted to 2021 prices using the Chinese CPI; applied every year the state is occupied No - source not obtained, so whether the figure is an annual or a first-year cost could not be checked
Annual cost, non-fatal stroke state 28023.8 CNY Reference 14 As above Adjusted to 2021 prices using the Chinese CPI; applied every year the state is occupied No - source not obtained, so whether the figure is an annual or a first-year cost could not be checked
Utility, event-free 0.98 Table 3 marks reference 13 (ACCOMPLISH); the Methods cite references 14 and 19 instead ACCOMPLISH reports no utility, EQ-5D, SF-36 or quality-of-life outcome anywhere; references 14 and 19 not obtained None stated No - the table and the Methods name different sources, and the one the table names does not hold the value
Utility, non-fatal MI 0.87 Table 3 marks reference 13 (ACCOMPLISH); the Methods cite references 14 and 19 instead As above None stated No - same citation inconsistency
Utility, non-fatal stroke 0.77 Table 3 marks reference 14; the Methods cite references 14 and 19 Chinese-language journal; original not obtained None stated No - source not obtained
Utility, death 0 Convention - None Yes
Cycle length 1 year Stated in Methods ‘the Markov model cycle in this study was set to 1 year’ - Yes
Time horizon 10 cycles Stated in Methods ‘the Markov model was set to 10 cycles’ - Yes
Discount rate, base case Not reported - Appears only in the sensitivity analysis; 5% recovered by fitting the published totals (0-7% sweep, 5% is the only fit) - Recovered, not reported
Half-cycle correction Not reported - Not mentioned anywhere in the paper - No
Cost accrual by state Not fully reported - Methods state the event-free cost is the drug cost; nothing states whether drug cost continues after an event, or whether the MI and stroke figures are annual or one-off Recovered by back-solving the published totals: drug cost accrues only while event-free, event figures are annual state costs Recovered, not reported
PSA distributions Normal (costs), beta (probabilities and rates) Stated in Methods No standard deviations or shape parameters given - No - PSA not reproducible
Willingness-to-pay threshold 80976 CNY 2021 China Statistical Yearbook, GDP per capita Stated in Methods - Yes
Software TreeAge Pro 2021 Stated in Methods ‘The Markov model was created using TreeAge Pro 2021’ - Yes

2 · Results

Amlodipine plus benazepril costs less and delivers more. Over ten years it accrues about 8,400 CNY less and a tenth of a QALY more per patient, so it dominates — there is no incremental cost-effectiveness ratio to compute, and none that could be interpreted. That is the paper’s conclusion, and the rebuild reproduces it.

Code
reb <- run_both(drug_in = "event_free", event_cost = "prevalent")
reb <- reb[match(TARGET$arm, reb$arm), ]
kb(data.frame(
  Arm = TARGET$arm,
  `Cost, published` = sprintf("%.2f", TARGET$cost),
  `Cost, rebuilt`   = sprintf("%.2f", reb$cost),
  `Difference`      = sprintf("%+.2f%%", 100 * (reb$cost - TARGET$cost) / TARGET$cost),
  `QALY, published` = sprintf("%.2f", TARGET$qaly),
  `QALY, rebuilt`   = sprintf("%.4f", reb$qaly),
  `Difference `     = sprintf("%+.3f%%", 100 * (reb$qaly - TARGET$qaly) / TARGET$qaly),
  check.names = FALSE),
  caption = "Cell-by-cell reconciliation against Table 7.")
Cell-by-cell reconciliation against Table 7.
Arm Cost, published Cost, rebuilt Difference QALY, published QALY, rebuilt Difference
amlodipine 66196.97 66452.27 +0.39% 6.59 6.5884 -0.024%
hctz 74588.50 74515.72 -0.10% 6.46 6.4598 -0.003%

QALYs match to the precision the paper prints, and the incremental cost of 8,391.53 reproduces exactly. The 0.39% on the amlodipine total is not rounding; it is traced to a specific input in §3, and closing it makes amlodipine slightly cheaper still.

The paper nonetheless reports an ICER of −64,550.23 alongside a decision entry of “Advantage plan”. A negative ratio under dominance has no reading; §3 takes that up, along with a second value the paper gives for the same quantity.

Everything below comes from the independent R rebuild. Two accounting rules and the discount rate are not fully specified in the paper and had to be fitted to the published totals; that is set out at the end of the page.

The paper carries five result figures, and it is worth being precise about what each figure below is:

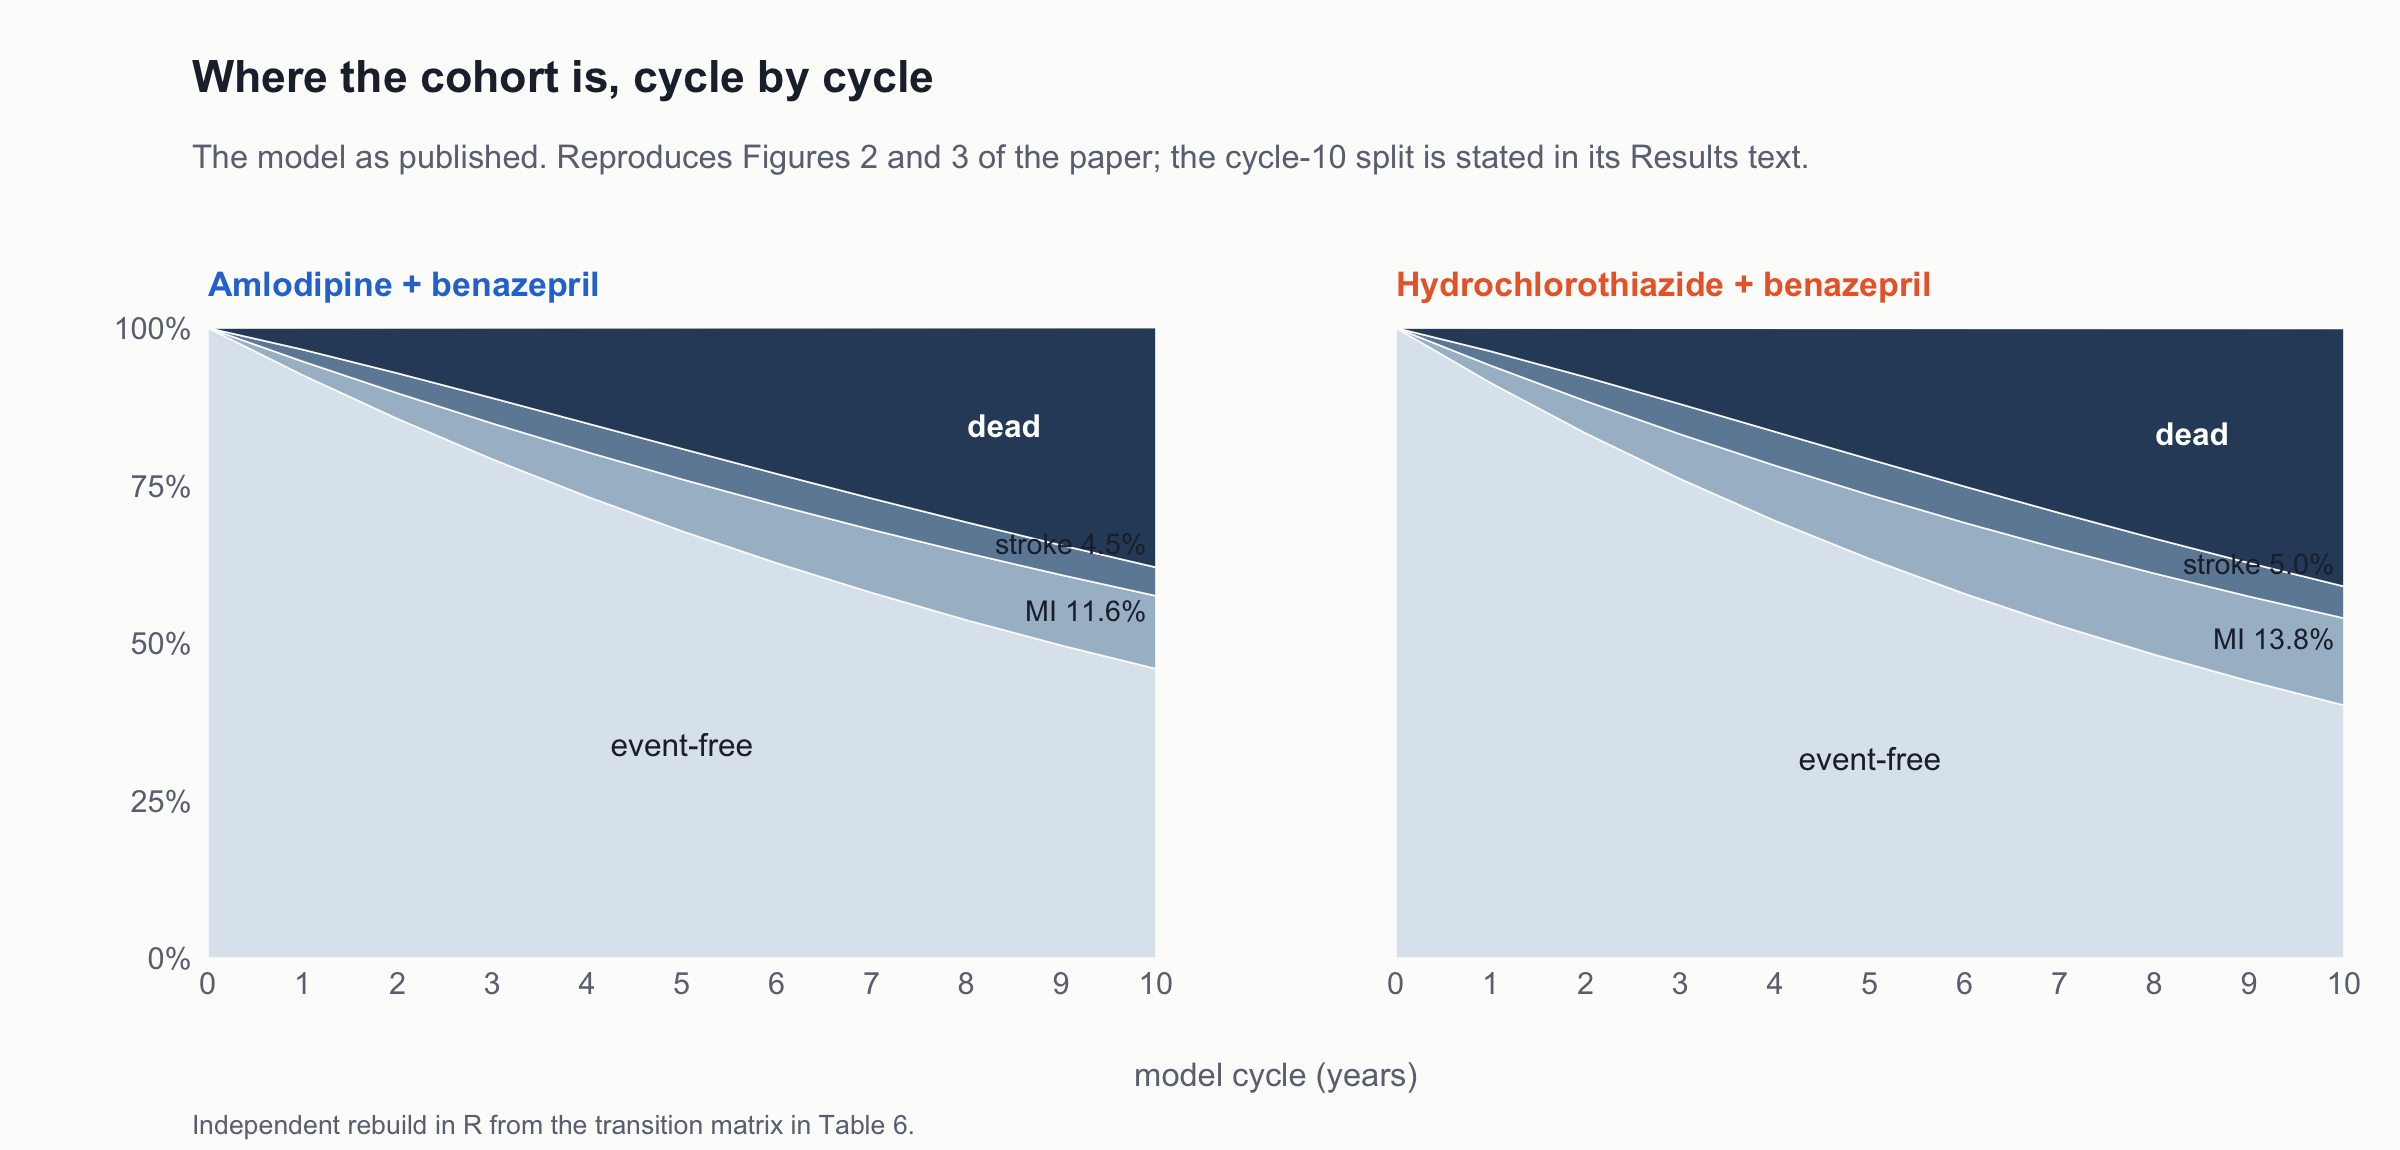
Figure 2 reproduces the paper’s Figures 2 and 3
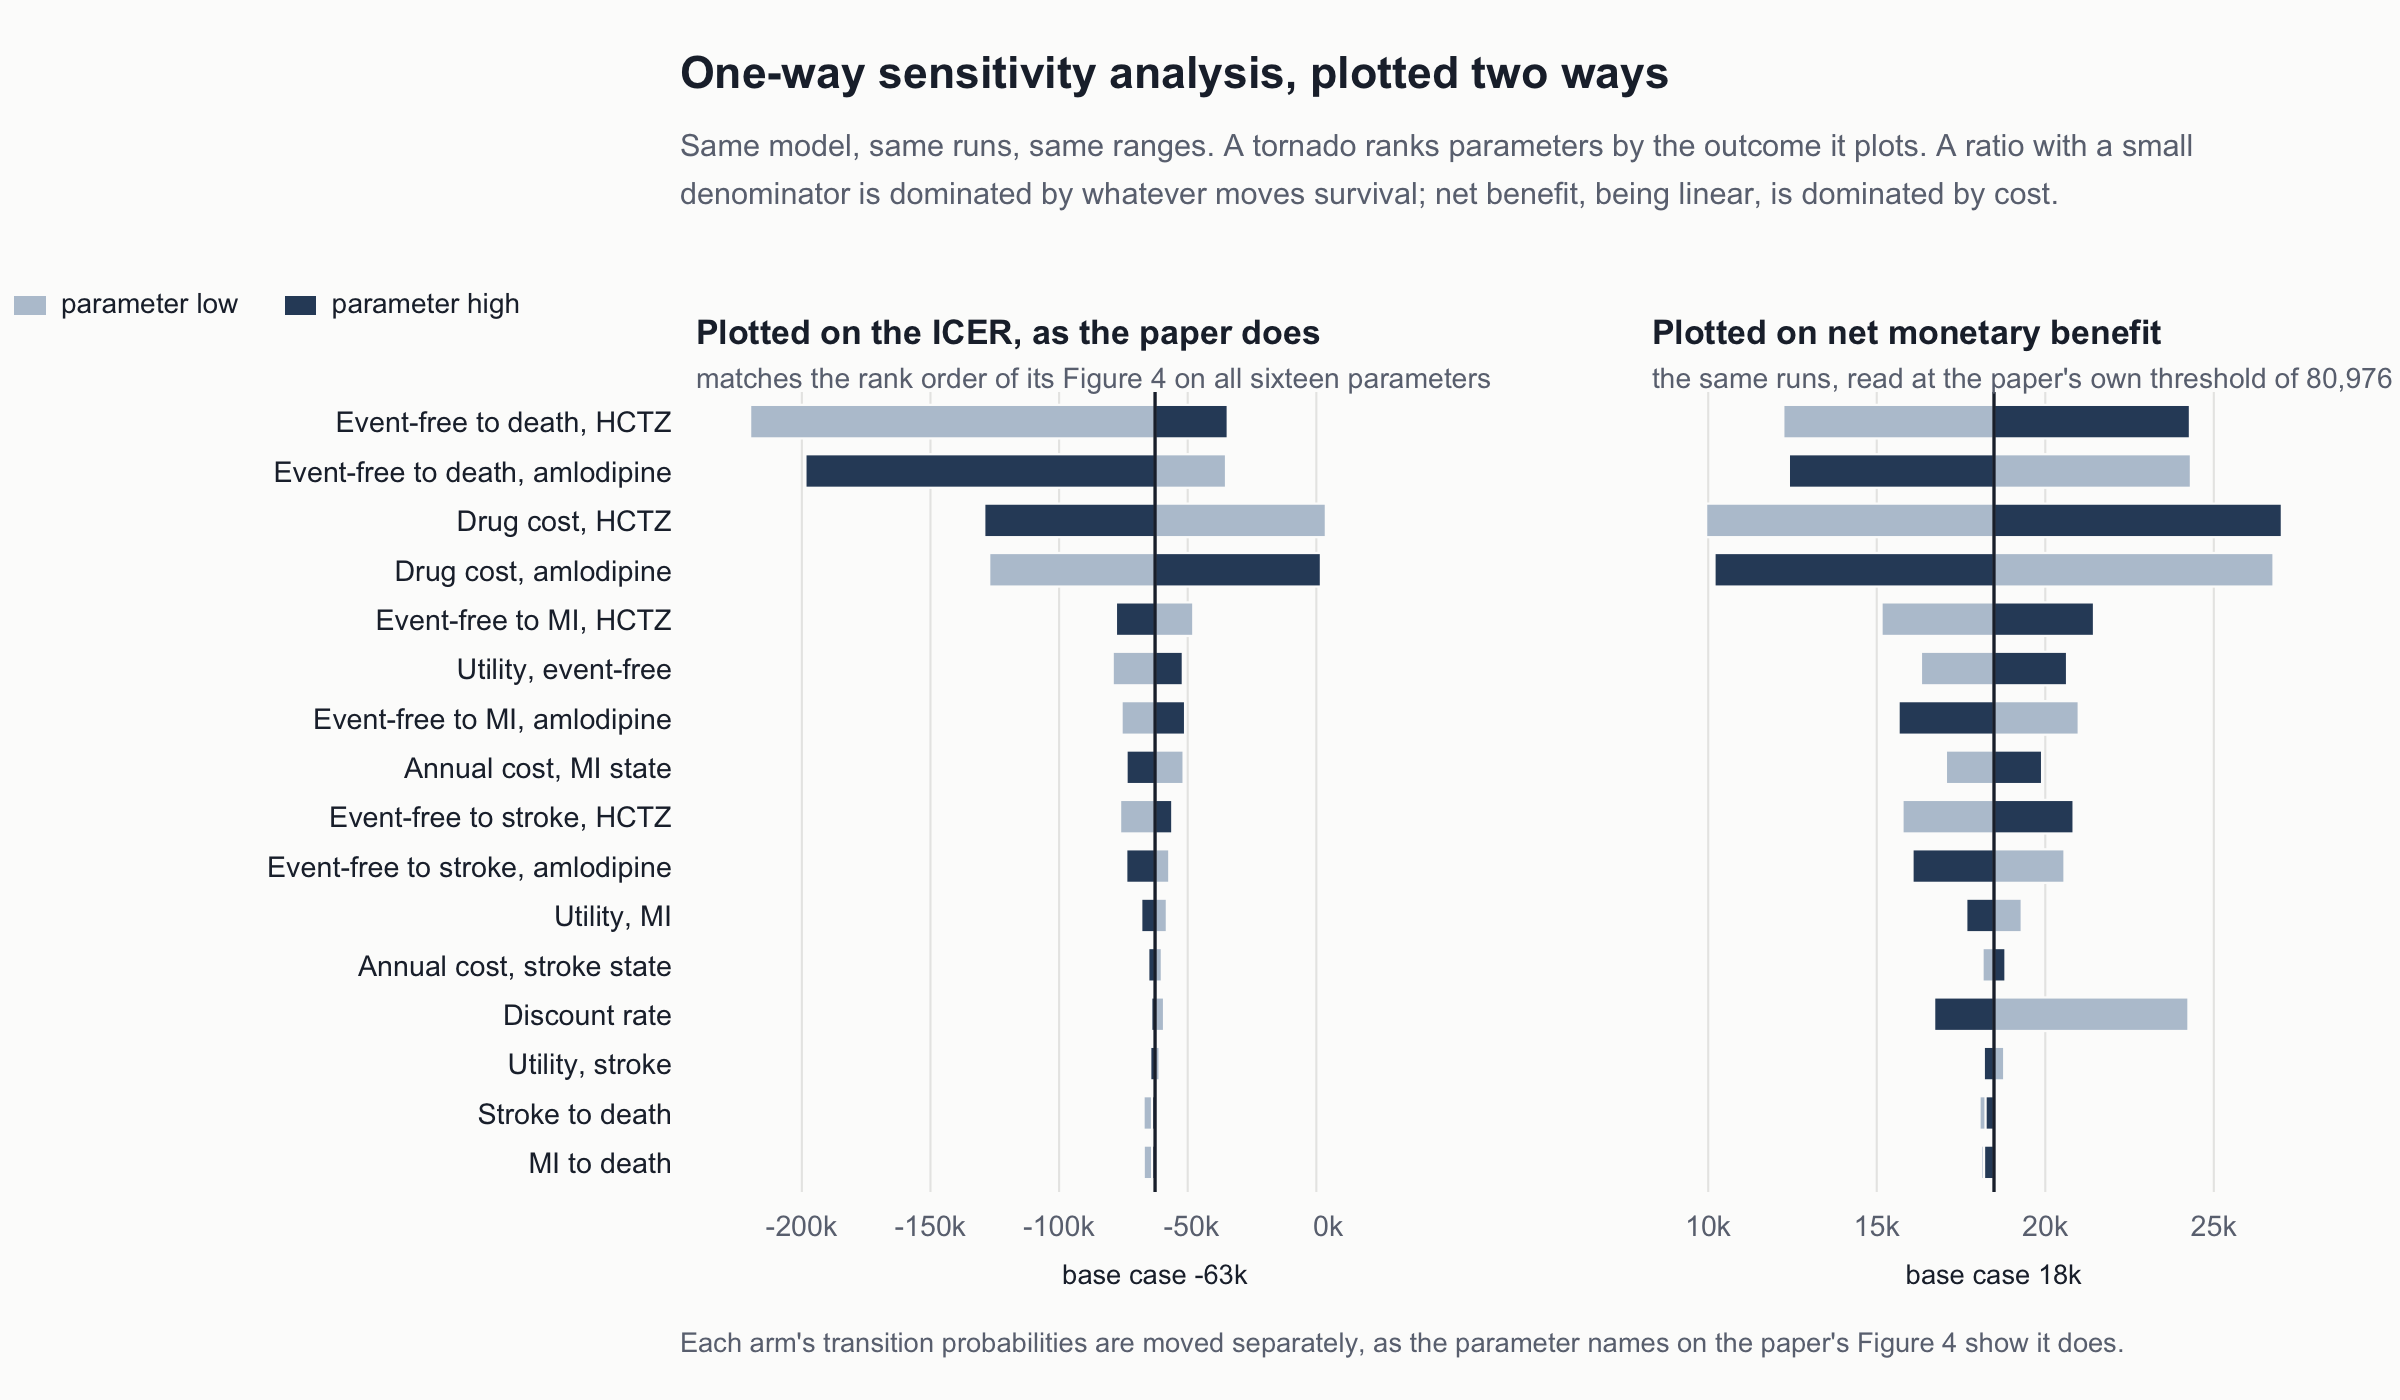
Figure 4 answers the question of its Figure 4, on a different outcome — the one it uses has no interpretation under dominance
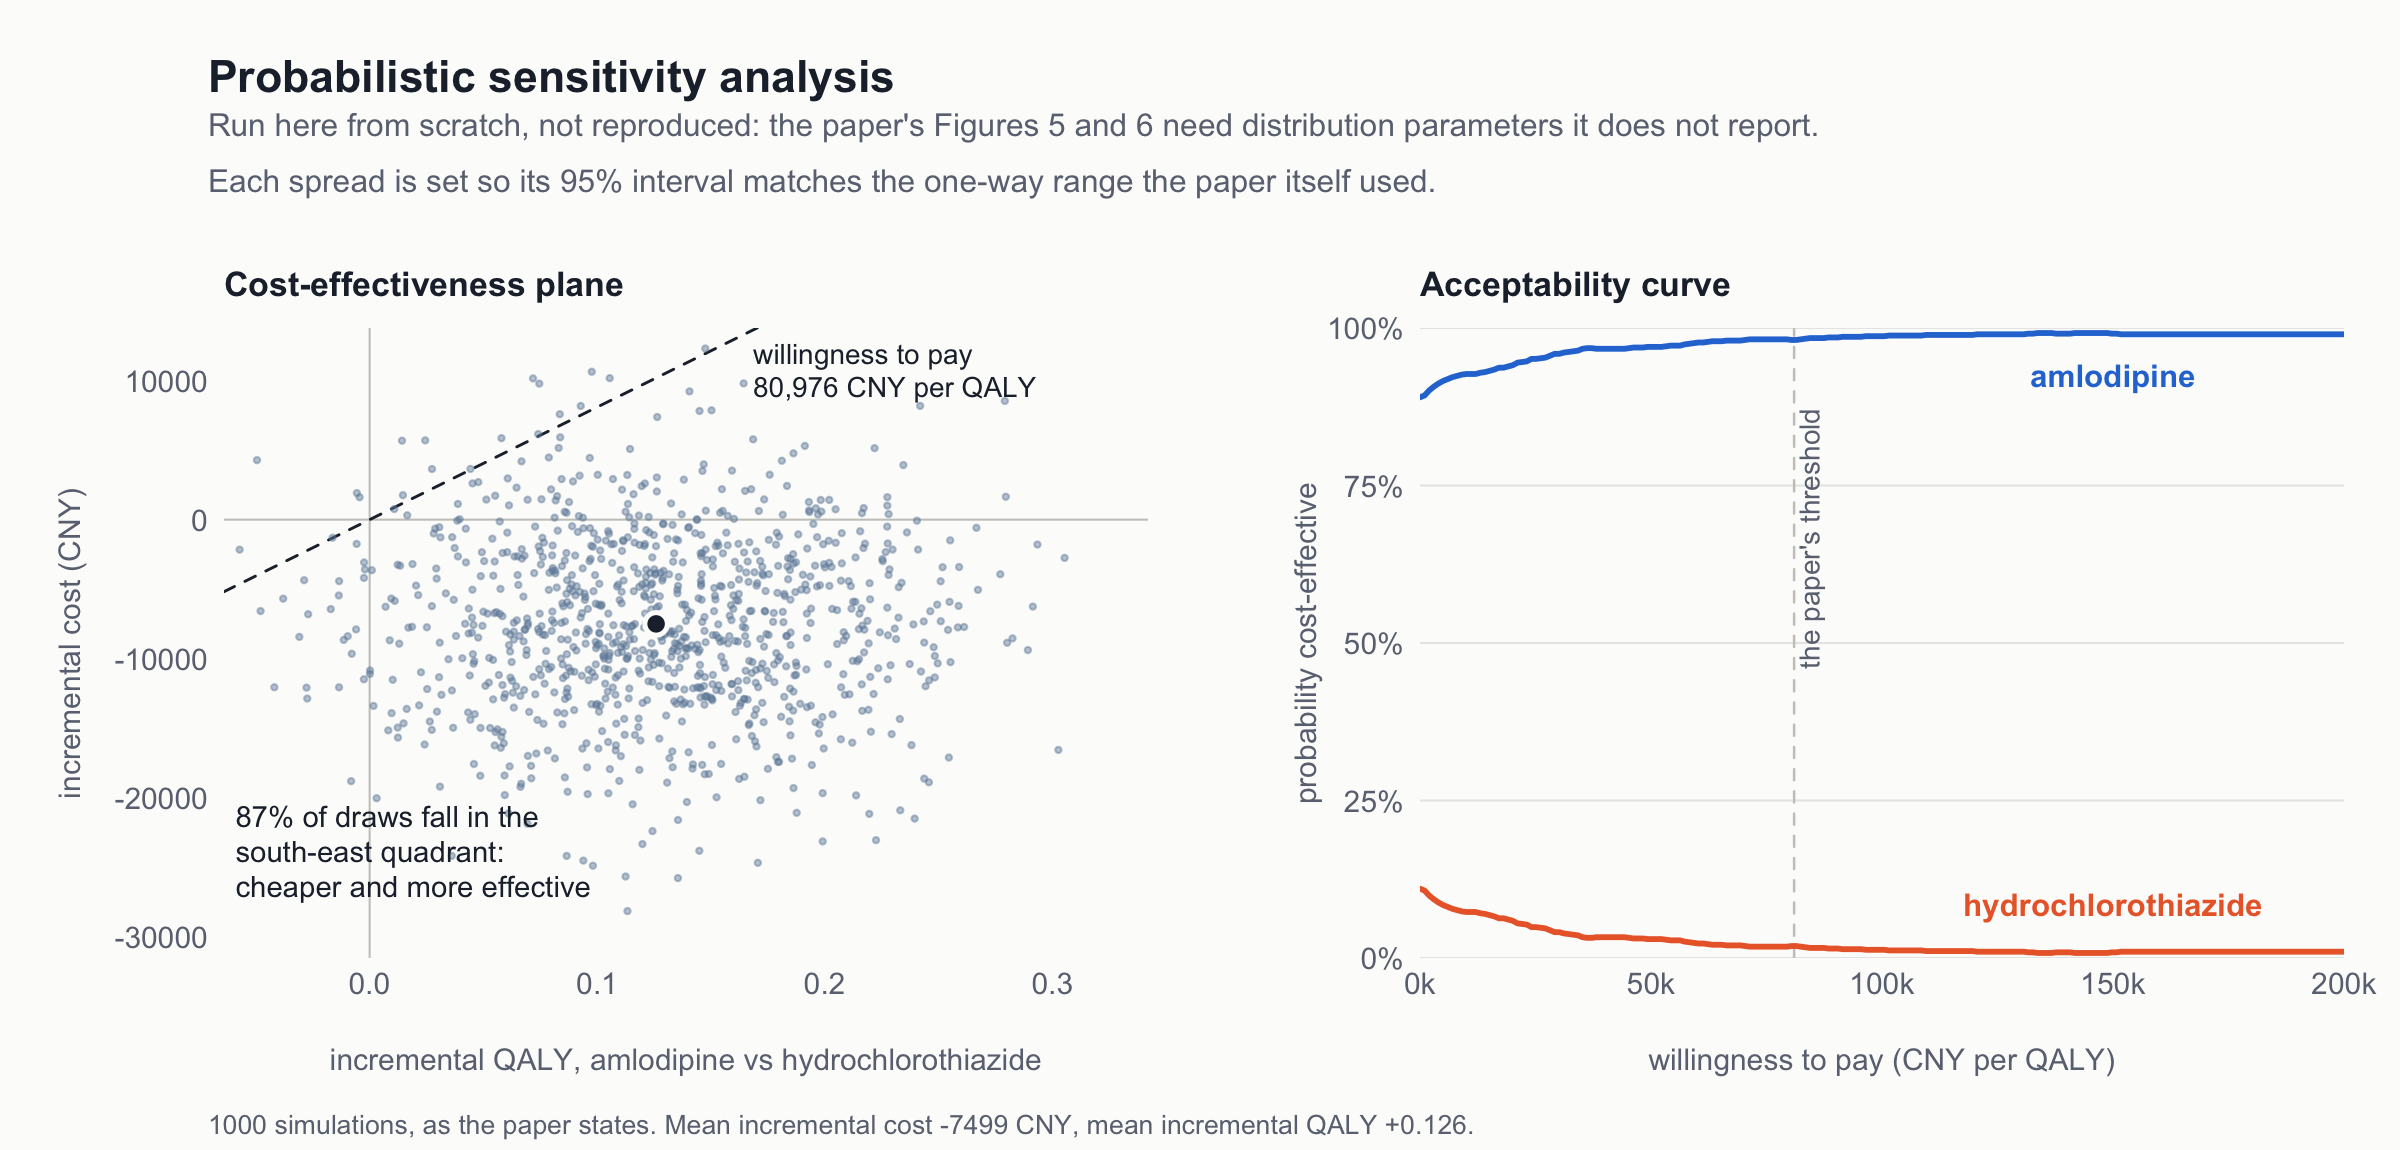
Figure 3 cannot reproduce its Figures 5 and 6, because the parameters those need are not published; built here on stated assumptions instead

Nothing on this page is copied from the paper. Every number and every mark is computed from the published inputs by the code behind it, which is folded into the page and can be opened chunk by chunk.

The cohort over time

Figure 2: Where the cohort sits in each cycle, under the model as published. This reproduces the content of the paper’s Figures 2 and 3, drawn as stacked areas rather than its four separate lines so that the four states are visibly one cohort. States take a sequential ramp because they are ordered by severity; the categorical blue and orange stay reserved for the arms.

By cycle 10 the amlodipine cohort is 45.9% event-free, 11.6% post-MI, 4.5% post-stroke and 38.1% dead. The paper’s own Results text reports 11.6%, 4.5% and 38.0% for the same three states — a match to the last digit it prints.

Uncertainty

Figure 3: Probabilistic sensitivity analysis: 1000 simulations run on the rebuilt model. Built here, not reproduced from the paper — its Figures 5 and 6 depend on distribution parameters it does not report, so the spreads are mine, each set so the parameter’s 95% interval matches the range the paper itself used in its one-way analysis. That choice sets the width of the cloud; it does not move the point estimate.

Under those assumptions amlodipine is cheaper and more effective in 87% of draws, and cost-effective at the paper’s own threshold in 98%. The 13% that fall outside the dominant quadrant are worth naming: dominance is the base-case result, not a certainty.

The reconstruction can be partly checked against the paper’s own figures even though it cannot reproduce them. At zero willingness to pay — where the question reduces to “is amlodipine cheaper?” — the paper’s Figure 5 reads 88% and this one gives 89%, so the assumed spread on the cost side is close to whatever the paper used. The effect side is not: the paper’s Figure 6 runs its horizontal axis from −0.30 to 0.50 incremental QALYs, while this cloud spans −0.06 to 0.31. The paper’s effect uncertainty is materially wider than what these assumptions generate, which is the honest limit of a reconstruction: it can be anchored, but not matched.

Figure 4: One-way sensitivity analysis, plotted twice from the same runs. The left panel uses the ICER, as the paper’s Figure 4 does, and reproduces its rank order on all sixteen parameters. The right panel uses incremental net monetary benefit at the paper’s own threshold, which is what a dominant comparison can actually be read on. Each arm’s transition probabilities are moved separately, as the parameter names on the paper’s figure show it does; ranges are the ones that figure prints.

No parameter, moved to either end of its stated range, takes the net benefit below zero. The base-case conclusion is stable inside the ranges the paper itself tested.

The left panel is the strongest single verification test in this case. Run the same analysis on the paper’s own axis and the rank order comes back identical on all sixteen parameters, from the two event-free-to-death transitions at the top to MI-to-death at the bottom. The bar extents line up too: the widest run spans −220,000 to −34,000 against roughly −240,000 to −35,000 as printed. A ratio with an effect difference of 0.125 in its denominator amplifies any disagreement in the engine that produced it; there is none to amplify.

Which is why the two panels look nothing alike, and why that is not a disagreement. A tornado ranks parameters by the outcome it plots. An ICER explodes as its denominator approaches zero, so anything that moves survival dominates it — hence the long left tails, which are the ratio misbehaving rather than the model being uncertain. Net benefit is linear in cost and in effect, so the cost inputs lead instead, and the discount rate moves from near-invisible to mid-table. Same model, same ranges, two defensible pictures.

⚠ The left panel also shows why the paper’s own axis is the wrong one to decide on: under dominance the ICER has no interpretation, and a bar that runs from −220,000 to −34,000 tells a reader nothing about whether the conclusion holds. The right panel does, and it never reaches zero.

3 · Verification and appraisal

Verification asks a narrow question: does the model do what its description says it does? TECH-VER sets out a checklist for answering it, in five stages worked in order — each one worth starting only once the stage before it holds.

  1. Model inputs — do the numbers going in match their sources, and each other?
  2. Event and state calculations — does the cohort move between states correctly?
  3. Result calculations — are the totals, the incremental figures and the decision rule right?
  4. Uncertainty analysis — are the sensitivity analyses correctly built, and reported well enough to check?
  5. Overall validation — does the model reproduce anything that can be verified from outside it?

Within each stage the checks escalate by how much work they cost. Black-box tests come first: push an input to an extreme and see whether the output does what it must — set every utility to zero and no QALYs should accrue; set mortality to zero and nobody should die. They need no sight of the code, they take minutes, and they catch a surprising share of what goes wrong. Only what survives them is worth the expensive work: white-box inspection, reading the calculation line by line, and then replication, rebuilding the model independently to see whether the same numbers come back.

This page is a replication, so all three are open to it. Most of what follows is black-box work even so, because that is where the cheap tests happened to bite.

Stage 1 — the inputs

The model runs on twenty-four numbers. They fall into four groups, and the verification result is different for each.

  • Sixteen transition probabilities. Every one is derived inside the paper from the ACCOMPLISH trial, and the derivation reconciles exactly — all six annual probabilities and both event-free death probabilities come back to four decimals. The arithmetic is right; the input to it looks wrong. The trial percentages it starts from are cumulative over a mean follow-up of 36 months, and they are converted as though they were annual — the paper prints a conversion formula carrying an observation period and never gives that period a value. On the face of it that inflates every event rate in the matrix about threefold. Stage 5 tests it rather than argues it.

  • Four costs. Two drug prices and two event-state costs. None can be checked against its source: the drug prices cite a tender website with no version or date, and the event costs cite a Chinese-language article that could not be obtained. One of the two drug prices also disagrees with the paper’s own Figure 4, which Stage 3 takes up.

  • Four utilities. The paper’s Table 3 and its Methods cite different sources for them, and the source the table names contains no utility data at all. Set out in §1.

  • The settings around them — cycle length, horizon, discount rate, perspective, half-cycle correction. Two are stated; the rest are not reported at all, which is collected below.

What the paper does not report

Verification keeps running into the same obstacle, so it is worth setting out in one place. None of the following appears anywhere in the paper — not in the its Methods, its tables, its figures, its Discussion or its limitations.

  • the analytic perspective — payer, health system or societal is never said, and which costs belong in scope follows from it
  • the base-case discount rate, and whether costs and outcomes are discounted alike
  • the observation period \(t_1\) in the rate conversion, and ACCOMPLISH’s follow-up duration — the two things a reader would need to check it
  • whether drug cost continues after an event, whether the event figures are annual or one-off, and what resource use they contain
  • the PSA distribution parameters — the families are given, the numbers are not
  • half-cycle correction
  • that the model forbids recurrent events and holds post-event mortality equal across arms — two structural restrictions with real consequences over ten years
  • why ten years rather than a lifetime horizon, which ISPOR-SMDM asks for where an intervention affects mortality
  • any model validation — no face validity exercise, no internal verification, no external check against the trial, no cross-model comparison

On the two structural restrictions, it is worth being exact about what “not declared” means here, because the paper does declare three assumptions of its own. They are, in full:

“(1) the probability of occurrence of various events in the two patient groups at the end of the trial is the same; (2) the health status transition probability in each cycle is the same as the probability of clinical trial events; (3) because the cost of adverse drug reactions is low, the analysis does not include the occurrence of adverse reactions.”

The first is about event probabilities persisting past the trial, the second is the conversion discussed above, the third is about adverse events. Neither the ban on recurrent events nor the equal post-event mortality appears in that list, or anywhere else in the paper. They are visible only in the transition matrix, where the MI and stroke rows each sum to one across just two destinations.

Stage 2 — the engine

The Results text reports the state distribution at cycle 10 for both arms — an independent check that constrains the trace without passing through a single cost or utility value.

Code
pub <- data.frame(arm = c("amlodipine", "hctz"),
                  Dead = c(38.0, 41.0), Stroke = c(4.5, 5.1), MI = c(11.6, 13.8))
reb <- do.call(rbind, lapply(c("amlodipine", "hctz"), function(a) {
  tr <- run_markov(a)$trace
  data.frame(arm = a, Dead = 100 * tr["10", "Dead"],
             Stroke = 100 * tr["10", "Stroke"], MI = 100 * tr["10", "MI"])
}))
p1 <- function(x) sprintf("%.1f%%", x)
kb(data.frame(Arm = pub$arm,
              `Dead, published` = p1(pub$Dead),  `Dead, rebuilt` = p1(reb$Dead),
              `Stroke, published` = p1(pub$Stroke), `Stroke, rebuilt` = p1(reb$Stroke),
              `MI, published` = p1(pub$MI), `MI, rebuilt` = p1(reb$MI),
              check.names = FALSE),
   caption = "Where the cohort sits at cycle 10, as reported in the paper's Results text and as rebuilt.")
Where the cohort sits at cycle 10, as reported in the paper’s Results text and as rebuilt.
Arm Dead, published Dead, rebuilt Stroke, published Stroke, rebuilt MI, published MI, rebuilt
amlodipine 38.0% 38.1% 4.5% 4.5% 11.6% 11.6%
hctz 41.0% 40.9% 5.1% 5.0% 13.8% 13.8%

Six cells, six matches to the last digit printed. The nine black-box tests TECH-VER specifies for this stage also pass: cohort conservation, non-negativity, monotone deaths, utilities set to one and to zero, costs set to zero, mortality set to zero. The transition engine is correct.

Stage 3 — the results

The reconciliation is in §2. QALYs are exact at the precision printed and the incremental cost of 8,391.53 reproduces exactly; the amlodipine total comes out 0.39% high.

That residual is a reporting inconsistency rather than arithmetic. Fourteen of the fifteen parameter ranges printed on the paper’s Figure 4 back-solve to the value in Tables 2 and 3. The fifteenth does not: the amlodipine drug price implies 5,459.50 where Table 2 prints 5,494.53. Run on the figure’s value, the arm total falls to 0.07% of the published one — within what the transition matrix’s four printed decimals allow.

Code
set.seed(20260826); HALF <- 0.00005
srow <- function(q) repeat { v <- q + runif(length(q), -HALF, HALF)
  v[length(v)] <- 1 - sum(v[-length(v)])
  if (abs(v[length(v)] - q[length(q)]) <= HALF) return(v) }
band <- function(drug) replicate(3000, {
  q <- TPM_PUBLISHED$amlodipine
  e <- srow(c(q[["EE"]], q[["EM"]], q[["ES"]], q[["ED"]]))
  m <- srow(c(q[["MM"]], q[["MD"]])); k <- srow(c(q[["SS"]], q[["SD"]]))
  t <- TPM_PUBLISHED
  t$amlodipine <- c(EE=e[1], EM=e[2], ES=e[3], ED=e[4], MM=m[1], MD=m[2], SS=k[1], SD=k[2])
  run_model(tpm = t, drug = replace(COST_DRUG, "amlodipine", drug))$cost[["amlodipine"]] })
fig <- (4094.6 + 6824.4) / 2
kb(do.call(rbind, lapply(c(COST_DRUG[["amlodipine"]], fig), function(v) {
  tot <- run_model(drug = replace(COST_DRUG, "amlodipine", v))$cost[["amlodipine"]]
  bd <- band(v)
  data.frame(`Amlodipine drug cost` = sprintf("%.2f", v),
    Source = if (v > 5470) "Table 2" else "implied by Figure 4",
    `Rebuilt arm total` = sprintf("%.2f", tot),
    `vs published 66,196.97` = sprintf("%+.2f  (%+.2f%%)", tot - 66196.97,
                                       100 * (tot - 66196.97) / 66196.97),
    `Within four-decimal rounding` = if (66196.97 >= min(bd) && 66196.97 <= max(bd))
      "yes" else "no", check.names = FALSE) })), row.names = FALSE,
  caption = "The amlodipine total on each of the two drug prices the paper gives.")
The amlodipine total on each of the two drug prices the paper gives.
Amlodipine drug cost Source Rebuilt arm total vs published 66,196.97 Within four-decimal rounding
5494.53 Table 2 66452.27 +255.30 (+0.39%) no
5459.50 implied by Figure 4 66240.78 +43.81 (+0.07%) yes

A documented value and an implemented value differing by 35 CNY a year, findable only by reading a figure’s small print against a table. Nothing material turns on it; every number elsewhere on this page uses Table 2’s.

Dominance is reported as a ratio. Amlodipine is cheaper and more effective, so the correct entry is dominated; Table 7 prints an ICER of −64,550.23 next to a decision of “Advantage plan”. The paper also gives a second value for the same quantity — Figure 4 is centred on −67,133.56 — because Table 7 divides by the effect difference as printed, 0.13, while the figure uses the unrounded 0.125.

Stage 4 — uncertainty

The paper gives distribution families — normal for costs, beta for probabilities and rates — but no standard deviations and no shape parameters, so its probabilistic analysis cannot be reproduced; Figure 3 is a reconstruction on stated assumptions, not a replication. The one-way analysis is a different matter: its Figure 4 prints every parameter’s name and its low and high value on the face of the figure, which is better reporting than most published tornados manage and is what made Figure 4 checkable at all.

Worth noting for its own sake: those ranges perturb input values. The two findings in Stages 1 and 5 are structural, and nothing inside the stated ranges reaches them.

Stage 5 — validation

The model’s death transitions were derived from ACCOMPLISH’s three-year mortality, so running the model over ACCOMPLISH’s own three years should give that mortality back. It does not.

Figure 5: Cumulative all-cause death in the modelled cohort. Colour is the arm as before; line style is the version — solid as published, dashed with the trial percentages annualised over the 36 months actually observed. The shaded band is the trial’s own follow-up, the only stretch where the model can be checked against evidence rather than extrapolated. The black marker is what ACCOMPLISH observed.
Code
kb(do.call(rbind, lapply(names(TRIAL), function(a) {
  run3 <- function(p) { m <- make_tpm(p)
    x <- matrix(0, 11, 4, dimnames = list(0:10, STATES)); x[1, "EventFree"] <- 1
    for (t in 1:10) x[t + 1, ] <- x[t, ] %*% m; x }
  pu <- run3(TPM_PUBLISHED[[a]]); co <- run3(corr_tpm(a))
  data.frame(Arm = a,
    `Trial observed` = sprintf("%.1f%%", 100 * TRIAL[[a]][["death"]]),
    `Model at cycle 3, as published` = sprintf("%.1f%%", 100 * pu["3", "Dead"]),
    `Model at cycle 3, annualised` = sprintf("%.1f%%", 100 * co["3", "Dead"]),
    check.names = FALSE) })), row.names = FALSE,
  caption = "The round trip. Column two is what went into the model; column three is what comes back out of it over the same three years; column four is what comes back once the conversion uses the period the trial actually ran.")
The round trip. Column two is what went into the model; column three is what comes back out of it over the same three years; column four is what comes back once the conversion uses the period the trial actually ran.
Arm Trial observed Model at cycle 3, as published Model at cycle 3, annualised
amlodipine 4.1% 11.2% 4.1%
hctz 4.5% 12.1% 4.4%

The round trip does not close. What went in as 4.1% comes back out as 11.2%. Correcting the conversion closes it — 4.1% in, 4.1% out — which is what a sound conversion has to do. Seven of the model’s ten years sit outside anything the trial observed — ordinary for a Markov model, and not a criticism. What matters is the other three.

Does any of it change the answer?

Code
TPM_SAVE <- TPM_PUBLISHED
TPM_PUBLISHED <- lapply(names(TRIAL), corr_tpm); names(TPM_PUBLISHED) <- names(TRIAL)
cc <- run_both(drug_in = "event_free", event_cost = "prevalent")
cc <- cc[match(TARGET$arm, cc$arm), ]
TPM_PUBLISHED <- TPM_SAVE
kb(data.frame(
  Version = c("As published", "Conversion corrected"),
  `Incremental cost (CNY)` = sprintf("%+.0f", c(diff(TARGET$cost), diff(cc$cost))),
  `Incremental QALY` = sprintf("%+.4f", c(diff(TARGET$qaly), diff(cc$qaly))),
  `Amlodipine dominant` = c("yes", "yes"), check.names = FALSE), row.names = FALSE,
  caption = "Hydrochlorothiazide relative to amlodipine.")
Hydrochlorothiazide relative to amlodipine.
Version Incremental cost (CNY) Incremental QALY Amlodipine dominant
As published +8392 -0.1300 yes
Conversion corrected +5611 -0.0618 yes

Not the direction. Correcting the conversion halves the health gain and narrows the cost gap by a third, and amlodipine still costs less and delivers more. Two other things were tested for the same reason and behave the same way: charging the event costs once rather than annually cuts the cost gap to a third of the published one, and hydrochlorothiazide’s price would have to fall 23.6% — below amlodipine’s — before the two arms cost the same.

Everything found here is about the size of the answer, not its sign. That is worth being plain about, because it is the difference between a model that is wrong and a model whose numbers should not be quoted.

The checklist

This is the full record of what was checked on the paper’s model — whether it does what the paper says it does, and whether its inputs and its reporting hold up. It is not a judgement on the clinical question.

The rows come from two places. Most are TECH-VER’s own items, adapted to a four-state cohort model: the black-box tests each stage prescribes, the completeness and consistency tests that precede them, and the result and uncertainty checks. The rest are checks the rebuild itself generated — questions that could only be asked once there was a working model to ask them of, such as whether the trial figures come back out of it, or whether the inputs printed in the tables are the inputs it ran on. TECH-VER items that assume a spreadsheet implementation — hidden sheets, external links, password protection — are left out, because the model is a TreeAge file that was not available.

This is the model checklist for the rebuild. Each row carries one of four verdicts — pass, not pass, N/A, cant_verify — and a single line of reason. cant_verify marks a check that could not be completed, which is not the same as one that failed; four rows carry it, and each names what was missing.

Code
ck <- read.csv("data/techver_checklist.csv", check.names = FALSE)
kb(as.data.frame(t(table(factor(ck$Verdict,
     levels = c("pass", "not pass", "cant_verify", "N/A")))))[, -1],
   col.names = c("Verdict", "Items"), row.names = FALSE)
Verdict Items
pass 22
not pass 25
cant_verify 4
N/A 2
Stage Check Verdict Note
1. Model inputs Transition probabilities in Table 6 reconcile to the derivation in Tables 4-5 pass 1-exp(-p) reproduces all six probabilities exactly; PH-D reproduces by subtraction to four decimals
1. Model inputs All transition probabilities lie within [0,1] pass Checked for both arms
1. Model inputs Raising the drug price raises total cost pass Monotone across a 4800-6000 CNY sweep
1. Model inputs Implementation matches the paper’s own account of which costs are included not pass Limitations state only medicine costs were counted, but the published totals reproduce only with the MI and stroke state costs included
1. Model inputs Inputs reconcile to their cited sources not pass Table 3 attributes utilities 0.98 and 0.87 to ACCOMPLISH, which reports no utility outcome; the Methods attribute the utilities to two other references the table never names
1. Model inputs Every input has a retrievable source not pass Drug prices cite a tender website with no version or date; three inputs cite a Chinese-language article not obtained
1. Model inputs Each row of the transition matrix sums to one not pass The event-free row as printed sums to 1.0001: PH-E is the complement of the unrounded values while the other three are each rounded independently. A display artefact, not a modelling one
1. Model inputs Observation period of the source data matches the conversion applied not pass ACCOMPLISH’s percentages are cumulative over a mean 36-month follow-up and are converted as though annual; run over the trial’s own three years the model returns 11.2% cumulative death where 4.1% went in
1. Model inputs Event definitions in the source match the states they populate not pass The 2.2% and 1.9% figures are ‘fatal and nonfatal’ events, used to populate non-fatal states while death is modelled separately
1. Model inputs Analytic perspective stated not pass Nothing in the paper states whether the evaluation takes a payer, health-system or societal perspective
1. Model inputs The observation period used in the rate conversion is reported not pass The Methods print the conversion with t1 as a free argument and never assign it a value; the trial’s follow-up duration is not mentioned either
1. Model inputs Inputs printed in the tables are the inputs the model ran on not pass Fourteen of the fifteen ranges on Figure 4 back-solve to the value in Tables 2 and 3; the amlodipine drug price implies 5459.50 where Table 2 prints 5494.53, and only the former reproduces the published total
1. Model inputs The two columns of Table 5 are reconcilable to one conversion not pass Back-solving the observation period linking them gives about 3.3 years for three rows, exactly one year for a fourth and four weeks for the fifth; the left-hand column is used by nothing in Table 6 or the model
1. Model inputs Rates, probabilities and percentages are named and scaled correctly not pass Tables 5 and 6 are both headed (%) but hold probabilities - 0.9251 is not 0.9251%; ISPOR-SMDM asks that rates never be shown as percentages and probabilities never be called rates
1. Model inputs Post-event fatality inputs locatable in the cited source cant_verify 27.2% does not appear in ACCOMPLISH; 6.3% appears once, as a different endpoint in the other arm
2. Event and state calculations State occupancy sums to the cohort in every cycle pass Black-box test from TECH-VER Table 2, run on the rebuild
2. Event and state calculations All occupancies and probabilities are non-negative pass Black-box test from TECH-VER Table 2, run on the rebuild
2. Event and state calculations Cumulative deaths are monotonically non-decreasing pass Black-box test from TECH-VER Table 2, run on the rebuild
2. Event and state calculations Setting all utilities to one makes QALYs equal life-years pass Black-box test from TECH-VER Table 2, run on the rebuild
2. Event and state calculations Setting all utilities to zero accrues no QALYs pass Black-box test from TECH-VER Table 2, run on the rebuild
2. Event and state calculations Scaling all utilities down lowers QALYs pass Black-box test from TECH-VER Table 2, run on the rebuild
2. Event and state calculations Setting all costs to zero accrues no cost pass Black-box test from TECH-VER Table 2, run on the rebuild
2. Event and state calculations Setting mortality to zero produces no deaths pass Black-box test from TECH-VER Table 2, run on the rebuild
2. Event and state calculations Cycle-10 occupancy matches the cohort analysis reported in the text pass Six of six cells match to the last printed digit across both arms
2. Event and state calculations Half-cycle correction implemented not pass Not mentioned anywhere; ISPOR-SMDM best practice III-14 asks for it in the first and final cycle when the horizon is not lifetime
2. Event and state calculations Structural restrictions declared not pass The three stated assumptions cover neither the absence of recurrent events nor the treatment-independent post-event mortality
2. Event and state calculations Whole cohort dead by the end of the horizon N/A Ten-year horizon, not lifetime, so TECH-VER’s lifetime test does not apply
3. Result calculations Cost-effectiveness ratio equals total cost divided by total QALYs pass Both arms reconcile exactly
3. Result calculations Incremental cost equals the difference of the arm totals pass 8391.53 reproduces exactly
3. Result calculations Direction of the incremental effect is correct pass Amlodipine accrues more QALYs, consistent with its lower event probabilities
3. Result calculations Independent rebuild reconciles to Table 7 on QALYs pass 6.5884 and 6.4598 against 6.59 and 6.46, exact at the precision published
3. Result calculations Independent rebuild reconciles to Table 7 on cost, HCTZ arm pass 74515.72 against 74588.50, within the range that four-decimal rounding of the transition matrix allows
3. Result calculations Dominance reported correctly not pass Amlodipine is both cheaper and more effective; a negative ICER of -64550.23 is reported where ‘dominated’ is the correct entry
3. Result calculations Discount rate reported, and applied consistently to costs and outcomes not pass No base-case rate is stated - 5% appears only as a sensitivity re-run and had to be fitted - and nothing says whether costs and QALYs were discounted alike
3. Result calculations Cost accrual rule reported not pass Recovered by back-solving; the intuitive alternative undershoots the published costs by 28-31%
3. Result calculations Independent rebuild reconciles to Table 7 on cost, amlodipine arm not pass 66452.27 against 66196.97 on Table 2’s drug price, further apart than rounding can account for; the gap closes to 0.07% on the price implied by Figure 4’s printed range
4. Uncertainty analysis One-way sensitivity ranges reported pass Stated in the Methods and printed parameter by parameter on Figure 4
4. Uncertainty analysis Tornado diagram reproducible from reported numbers pass Figure 4 prints each parameter’s low and high value, so the analysis can be re-run; doing so reproduces its rank order on all sixteen parameters
4. Uncertainty analysis PSA distribution parameters reported not pass Families are given - normal for costs, beta for probabilities and rates - but no standard deviations or shape parameters
4. Uncertainty analysis Distribution families appropriate to the parameters they cover not pass Beta is declared over ‘all probability and rate values’; rates are not confined to the unit interval
4. Uncertainty analysis Sensitivity analysis reaches the assumptions the result is actually sensitive to not pass The stated ranges perturb input values; the annualisation and the cost-accrual rule are structural and lie outside them
4. Uncertainty analysis Every parameter in the model appears among the reported inputs not pass Figure 4 varies a utility of death and a cost of death; neither appears in Table 2 or Table 3, where both are zero
4. Uncertainty analysis PSA reproducible cant_verify Follows from the missing distribution parameters
5. Overall validation The same check after correcting the annualisation pass 4.1% and 4.4% against 4.1% and 4.5% in: the round trip closes
5. Overall validation Robustness of the cost result to the drug price pass HCTZ would have to fall 23.6% to 4527.89 CNY - below the amlodipine price - before the arms cost the same, so the ordering is not load-bearing
5. Overall validation Robustness of the conclusion to the annualisation pass Correcting it halves the incremental QALY, from -0.130 to -0.062, and cuts incremental cost from 8392 to 5611 CNY; amlodipine remains both cheaper and more effective
5. Overall validation Round trip: the trial mortality used to build the model comes back out of it not pass At cycle 3, roughly the trial’s own length, the model gives 11.2% and 12.1% cumulative death where 4.1% and 4.5% went in
5. Overall validation Face validity: utility of the event-free state not pass 0.98 places the cohort close to full health, while the cohort is defined by 60% diabetes, 23% prior MI and a median age of 68
5. Overall validation Any model validation is reported not pass No face validity exercise, no internal verification, no external validation against the trial, and no cross-model comparison is reported anywhere
5. Overall validation Time horizon justified against the decision problem not pass Ten years is justified by the cohort’s age alone; ISPOR-SMDM asks for a lifetime horizon where the intervention affects mortality, and no comparison against a lifetime horizon is reported
5. Overall validation Face validity: relative drug prices cant_verify The ordering that makes HCTZ the dearer generic cannot be checked against the cited website
5. Overall validation Event-state costs are defined on a basis that matches how they are applied cant_verify Half of each total is an annual event charge, applied on average 3.9 times per MI; if the source figures are first-year costs the cost gap falls to a third, but the source could not be obtained
5. Overall validation Cross-model validation against other hypertension Markov models N/A Out of scope for this exercise; declared rather than attempted

Scope, and how this was built

An independent implementation in R of the model the paper describes, built from the inputs the paper prints and from the trial it cites. Every implementation choice — cycle timing, discount indexing, which states carry which cost — is a switch rather than a hard-wired constant, so each could be tested against the published totals rather than assumed.

Covered. The deterministic base case in full, the derivation of every transition probability from the trial, the provenance of every input, and the one-way analysis on the paper’s own ranges. Three sensitivities were run far enough to test the conclusion rather than describe it: the annualisation, the basis of the event costs, and the drug price.

Not covered. The probabilistic analysis cannot be reproduced, because the paper publishes distribution families and no parameters; Figure 3 is built on stated assumptions instead. Cross-model comparison against other hypertension models is validation rather than verification, and was declared out of scope rather than attempted.

Not obtainable. Two Chinese-language articles — reference 14, cited for the stroke utility and both event-state costs, and reference 19, named in the Methods as a source of utilities but absent from Table 3. Neither could be retrieved, so the rows depending on them are recorded as cant_verify rather than assessed. The paper’s own TreeAge file was likewise unavailable.

Three inputs had to be fitted. Whether drug cost continues after an event, whether the MI and stroke figures are annual or one-off, and the base-case discount rate are not reported. To make the rebuild runnable each was fitted to the published totals, and one setting fits in each case: drug cost accrues only while event-free, the event figures are annual state costs, the discount rate is 5%. The transition-probability findings do not use these settings.